SmokePing on Debian: Monitor Internet Latency and Packet Loss
- Last updated: Feb 18, 2026

This guide explains how to install and configure SmokePing on Debian to monitor network latency, packet loss, and jitter over time.
SmokePing provides detailed graphical metrics that help visualize round-trip time variations and detect instability or micro-outages on an Internet connection.
If you suspect reliability issues with your ISP or want continuous latency monitoring, SmokePing offers an efficient and lightweight open-source solution.
Tested Environment and Versions
- Operating System: Debian 13 (Trixie)
- SmokePing: 2.8.2
How to Install SmokePing on Debian
Install SmokePing on Debian using the official package repository:
- Update the package index:
root@server:~# apt update- Install SmokePing and its dependencies:
root@server:~# apt install smokepingOnce installed, the SmokePing service and Apache configuration are enabled automatically.
Access the web interface:
http://A.B.C.D/smokeping/By default, SmokePing collects data every 300 seconds. After one or two polling cycles, latency graphs should begin to appear.
Configure SmokePing Targets on Debian
In this section, we configure SmokePing targets to monitor external DNS servers and compare their latency over time.
For this example, we will monitor Cloudflare DNS (1.1.1.1), Google DNS (8.8.4.4), and create a MultiHost entry to visualize their combined latency metrics.
- Edit the
/etc/smokeping/config.d/Targetsfile to define monitored hosts:
*** Targets ***

probe = FPing

menu = Top
title = Network Latency Grapher
remark = Welcome to the SmokePing website of xxx Company. \
         Here you will learn all about the latency of our network.

+ Local

menu = Local
title = Local Network
#parents = owner:/Test/James location:/

++ LocalMachine

menu = Local Machine
title = This host
host = localhost
#alerts = someloss

++ CloudflareDNS

menu = Cloudflare DNS
title = Cloudflare DNS server
host = 1.1.1.1

++ GoogleDNS

menu = Google DNS
title = Google DNS server
host = 8.8.4.4

++ MultiHost

menu = Multihost Google and CloudFlare
title = CloudflareDNS and Google DNS
host = /Local/CloudflareDNS /Local/GoogleDNS- Restart the SmokePing service to apply the new target configuration:
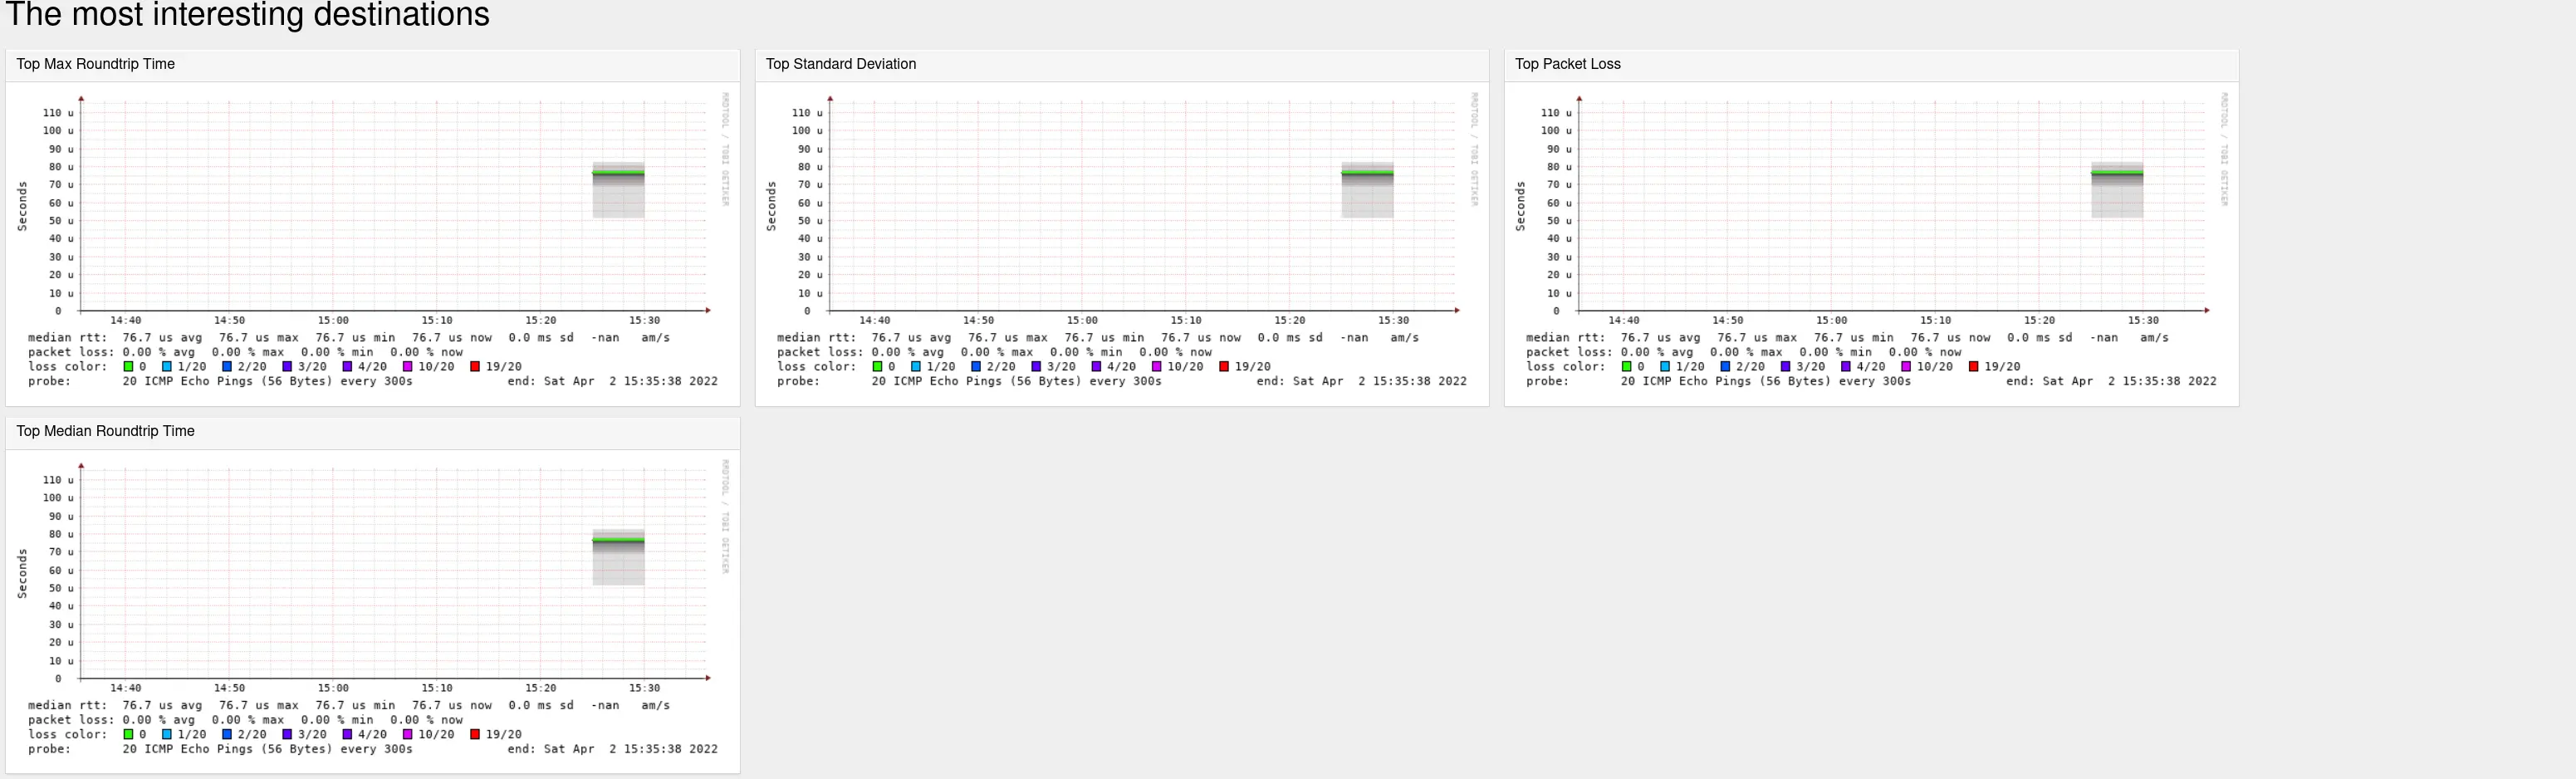
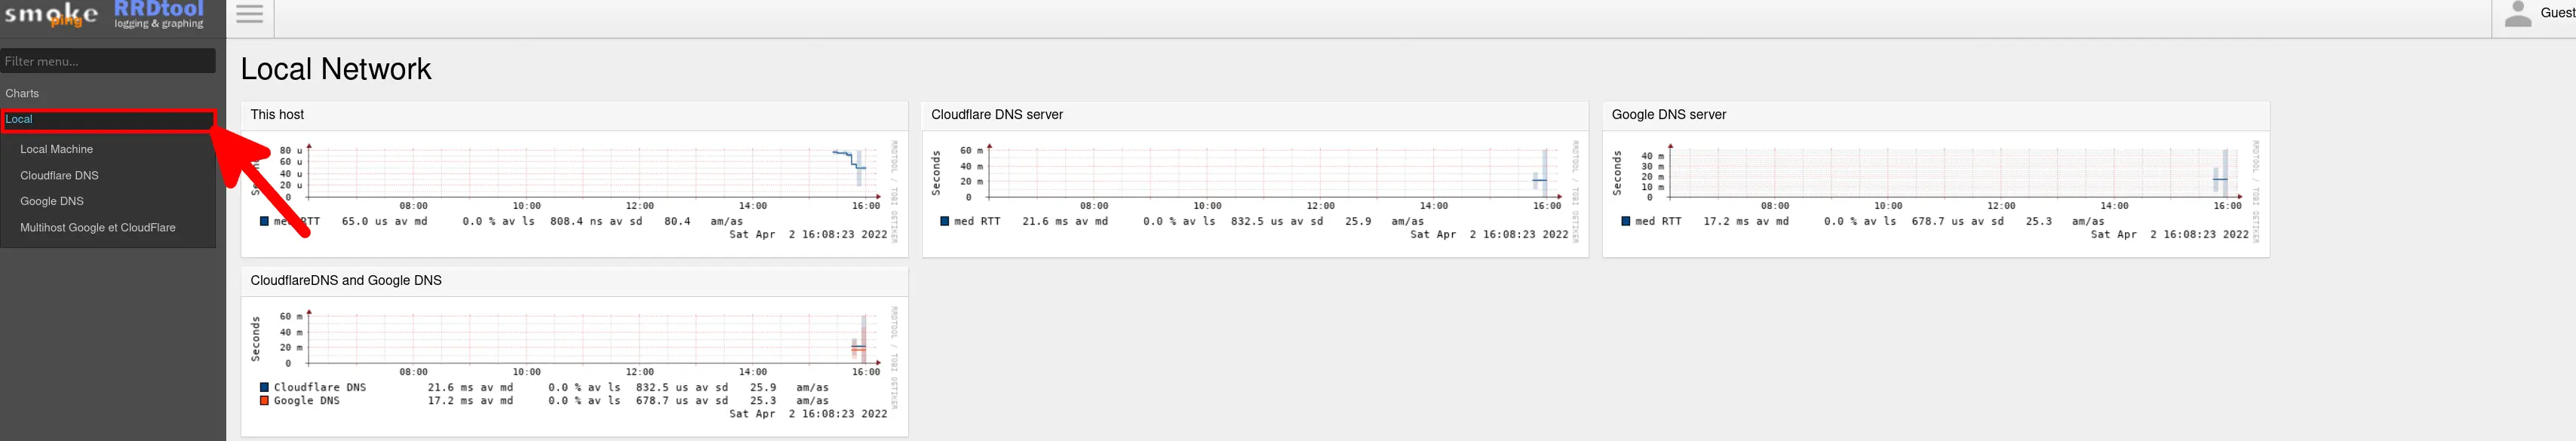
root@server:~# systemctl restart smokeping.service- After one or two polling cycles (default: 300 seconds), the new latency graphs should appear in the web interface:
Configure FPingContinuous Probe in SmokePing
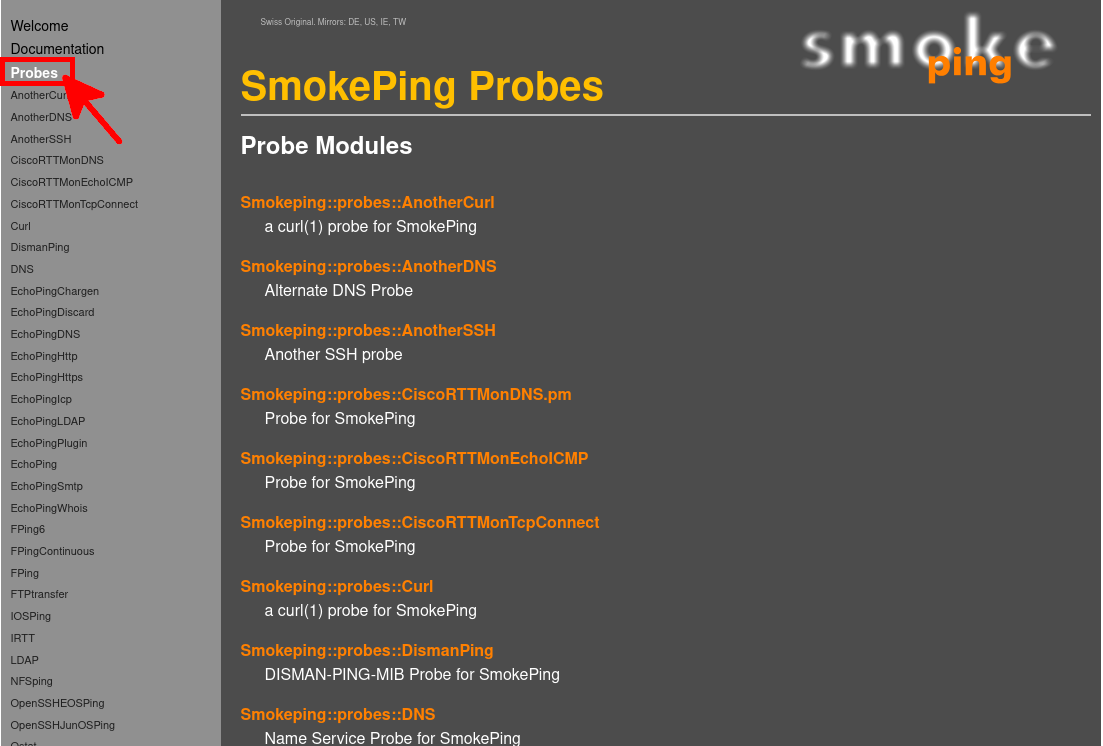
SmokePing supports multiple probe types depending on the monitoring method required. The complete list of available probes is documented on the official website: SmokePing probe documentation.
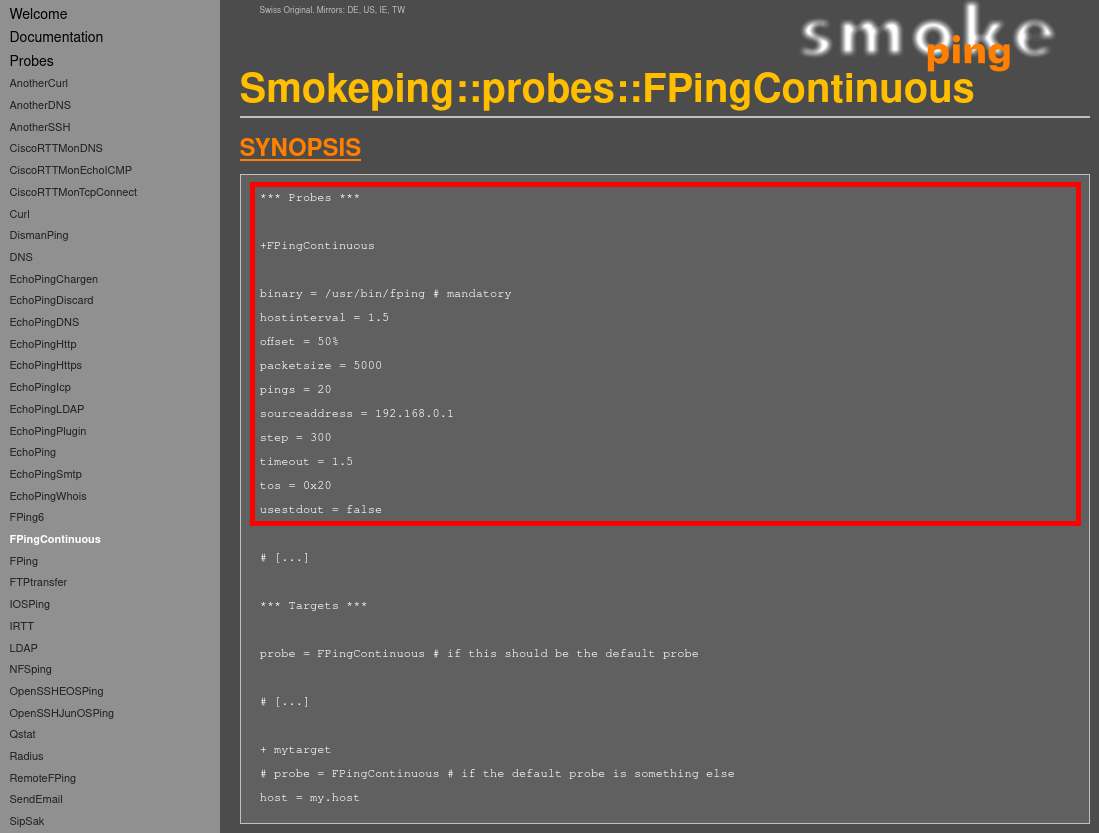
In this section, we configure the FPingContinuous probe. Compared to the default FPing probe, it improves scalability and provides more consistent latency measurements when monitoring multiple targets.
Unlike the standard FPing probe, FPingContinuous runs fping in continuous mode and streams results directly to SmokePing. This reduces process overhead and improves the detection of packet loss, jitter, and short-lived network instability.
- Copy the FPingContinuous probe configuration from the official documentation:
- Edit
/etc/smokeping/config.d/Probesand add the following probe section (keep existing probes unchanged):
*** Probes ***

+ FPing

binary = /usr/bin/fping

+ FPingContinuous

binary = /usr/bin/fping # mandatory
hostinterval = 1.5
offset = 50%
#packetsize = 5000
packetsize = 64
pings = 20
# sourceaddress = 192.168.0.1
step = 300
timeout = 1.5
tos = 0x20
usestdout = false- Edit
/etc/smokeping/config.d/Targetsto assign the FPingContinuous probe to a specific monitored host:
*** Targets ***

probe = FPing

menu = Top
title = Network Latency Grapher
remark = Welcome to the SmokePing website of xxx Company. \
         Here you will learn all about the latency of our network.

+ Local

menu = Local
title = Local Network
#parents = owner:/Test/James location:/

++ GoogleDNS

menu = Google DNS
title = Google DNS server
probe = FPingContinuous
host = 8.8.4.4
This overrides the default FPing probe and applies FPingContinuous only to the Google DNS target.
- Finally, restart the SmokePing service to apply the new probe configuration:
root@server:~# systemctl restart smokepingTroubleshooting and Debugging SmokePing
If SmokePing fails to start or does not collect data correctly, you can run it in debug mode to identify configuration errors.
- First, stop the systemd service:
root@server:~# systemctl stop smokeping- Then start SmokePing manually in debug mode:
root@server:~# smokeping --debugThis will display configuration parsing errors and probe-related issues directly in the terminal.
- The Smokeping working folder location:
root@server:~# ls /var/run/smokeping/- You can also inspect service logs:
root@server:~# journalctl -u smokeping