Elastic Stack 8 - Metricbeat pour monitorer l'utilisation matérielle
- Mise à jour le 14 oct. 2024

Nous avons précédement vu comment installer Elastic Stack ici et nous allons voir ici comment monitorer l'utilisation des ressources matérielle avec Metricbeat.
Ce module va nous permettre de surveiller la consommation de processeur, mémoire, réseau et utilisation disque depuis des vues graphiques.
Voyons donc comment l'installer sur Windows et GNU/Linux.
L'architecture Metricbeat

Installer Metricbeat
Metricbeat doit être installé sur chacune des machines que l'on souhaite monitorer depuis Elasticsearch.
Windows

Télécharger Metricbeat
- Se connecter sur le site officiel et télécharger l'archive zip :
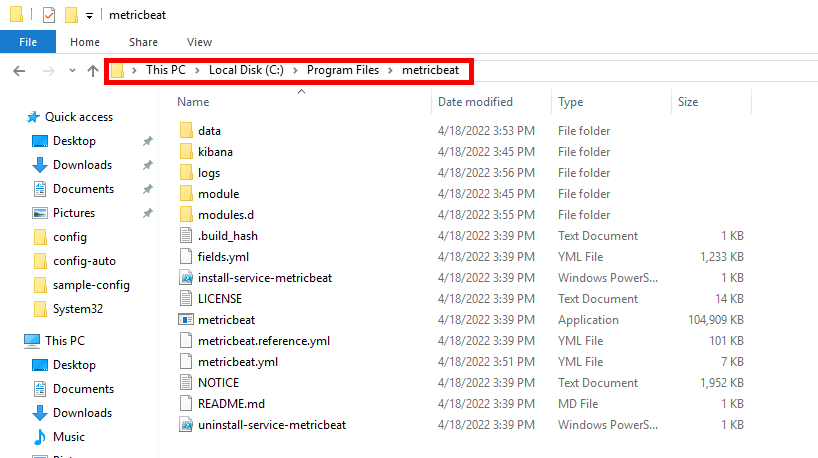
- Une fois téléchargé, dézipper les fichiers dans
C:\Program Files\metricbeat:
- Éditer le fichier
metricbeat.ymlet remplacer «X.X.X.X» par l'ip du serveur Elasticsearch et «elastic_password;)» par le mot de passe du compte utilisateur «elastic» :
# =================================== Kibana ===================================

# Starting with Beats version 6.0.0, the dashboards are loaded via the Kibana API.
# This requires a Kibana endpoint configuration.
setup.kibana:

  # Kibana Host
  # Scheme and port can be left out and will be set to the default (http and 5601)
  # In case you specify and additional path, the scheme is required: http://localhost:5601/path
  # IPv6 addresses should always be defined as: https://[2001:db8::1]:5601
  host: "https://X.X.X.X:5601"
  ssl.verification_mode: none
  username: "elastic"
  password: "elastic_password;)"

# ---------------------------- Elasticsearch Output ----------------------------
output.elasticsearch:
  # Array of hosts to connect to.
  hosts: ["X.X.X.X:9200"]

  # Protocol - either `http` (default) or `https`.
  protocol: "https"
  ssl.verification_mode: none

  # Authentication credentials - either API key or username/password.
  #api_key: "id:api_key"
  username: "elastic"
  password: "elastic_password;)"
Installer Metricbeat
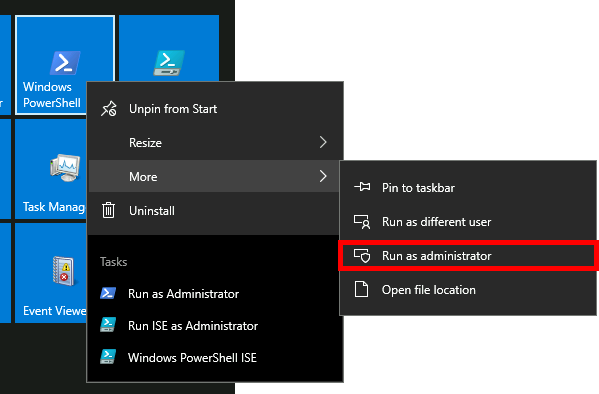
- Ouvrir une console PowerShell avec les droits administrateur :
- Se déplacer dans le répertoire
C:\Program Files\metricbeat:
PS C:\> cd "C:\Program Files\metricbeat"- Vérifier le fichier
metricbeat.yml:
PS C:\> .\metricbeat.exe test config -c .\metricbeat.yml- Installer le service Metricbeat :
PS C:\> powershell -executionpolicy Unrestricted -file .\install-service-metricbeat.ps1- Mettre en place les paramètres prédéfinis pour l'analyse, l'indexation, et la visualisation :
PS C:\> .\metricbeat.exe setup -e- Démarrer le service Metricbeat :
PS C:\> Start-Service metricbeatActiver le monitoring des I/O des disques (Optionnel)
Comme la mémoire ou le processeur, la performance des disques peut être la source des ralentissements su systèùe. C'est donc un élément essentiel à surveiller. Cela se fait par la mesure des I/O (qui donnent le taux de lecture et d'écriture). Dans la configuration par défaut de metricbeat, le module qui permet cette mesure est désactivé. Je vais donc expliquer ci-dessous comment activer le module diskio.
- Éditer le fichier
C:\Program Files\metricbeat\modules.d\system.ymlet décommenter la lignediskio:
# Module: system
# Docs: https://www.elastic.co/guide/en/beats/metricbeat/8.15/metricbeat-module-system.html

- module: system
  period: 10s
  metricsets:
    - cpu
    #- load
    - memory
    - network
    - process
    - process_summary
    - socket_summary
    #- entropy
    #- core
    - diskio
    #- socket
    #- service
#- users- Ensuite, redémarrer le service metricbeat afin que les modifications soient prises en compte :
PS C:\> Restart-Service metricbeatGNU/Linux

Installer Metricbeat
- Installer apt-transport-https et les paquets nécessaires :
root@host:~# apt update && apt-get install apt-transport-https gnupg curl wget- Importer la clé PGP Elasticsearch :
root@host:~# wget -qO - https://artifacts.elastic.co/GPG-KEY-elasticsearch | gpg --dearmor -o /usr/share/keyrings/elasticsearch-keyring.gpg- Ajouter le dépot elastic :
root@host:~# echo "deb [signed-by=/usr/share/keyrings/elasticsearch-keyring.gpg] https://artifacts.elastic.co/packages/8.x/apt stable main" | tee /etc/apt/sources.list.d/elastic-8.x.list- Installer le paquet Metricbeat :
root@host:~# apt update && apt-get install metricbeat/etc/metricbeat/metricbeat.yml
# =================================== Kibana ===================================

# Starting with Beats version 6.0.0, the dashboards are loaded via the Kibana API.
# This requires a Kibana endpoint configuration.
setup.kibana:

  # Kibana Host
  # Scheme and port can be left out and will be set to the default (http and 5601)
  # In case you specify and additional path, the scheme is required: http://localhost:5601/path
  # IPv6 addresses should always be defined as: https://[2001:db8::1]:5601
  host: "https://X.X.X.X:5601"
  ssl.verification_mode: none
  username: "elastic"
  password: "elastic_password;)"

# ---------------------------- Elasticsearch Output ----------------------------
output.elasticsearch:
  # Array of hosts to connect to.
  hosts: ["X.X.X.X:9200"]

  # Protocol - either `http` (default) or `https`.
  protocol: "https"
  ssl.verification_mode: none

  # Authentication credentials - either API key or username/password.
  #api_key: "id:api_key"
  username: "elastic"
password: "elastic_password;)"- Démarrer le service Metricbeat :
root@host:~# systemctl start metricbeat- Activer le démarrage automatique du service :
root@host:~# systemctl enable metricbeatActiver le monitoring des I/O des disques (Optionnel)
- Éditer le fichier
/etc/metricbeat/modules.d/system.ymlet comme expliqué dans la section Windows, décommenter la lignediskio:
# Module: system
# Docs: https://www.elastic.co/guide/en/beats/metricbeat/main/metricbeat-module-system.html

- module: system
  period: 10s
  metricsets:
    - cpu
    - load
    - memory
    - network
    - process
    - process_summary
    - socket_summary
    #- entropy
    #- core
    - diskio
- Puis redémarrer le service metricbeat :
root@host:~# systemctl restart metricbeatKibana
Vérifier les indices
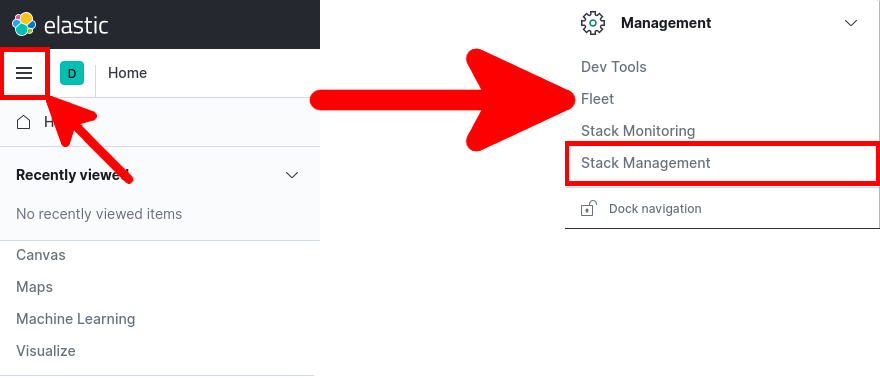
- Ouvrir Firefox et se connecter à l'adresse
https://KIBANA_IP_SERVER:5601/. Depuis le menu principal, aller dans Management > Stack Management :
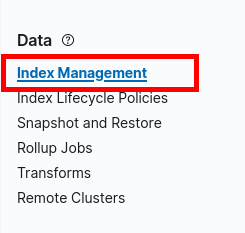
- Depuis Stack Management aller dans Data > Index Management :
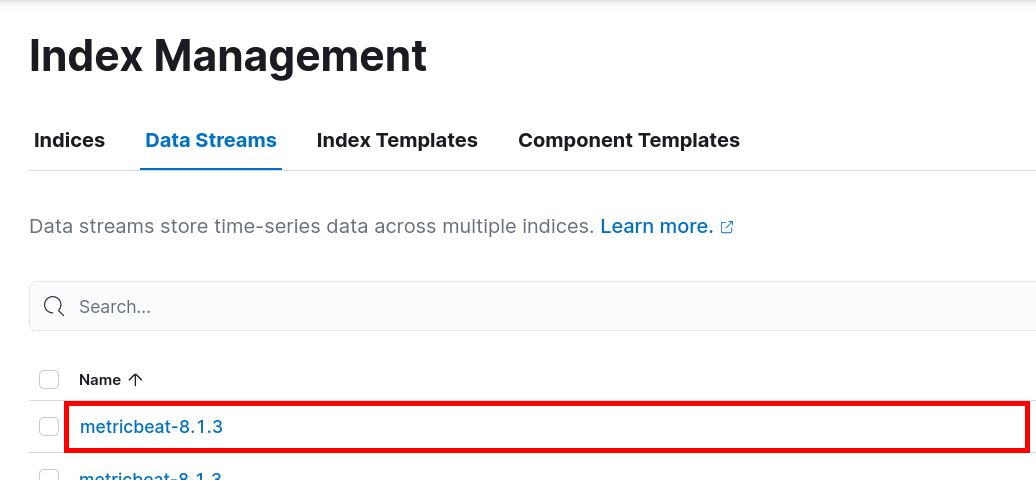
- Dans Data Streams des indices devraient être présents :
Dashboard
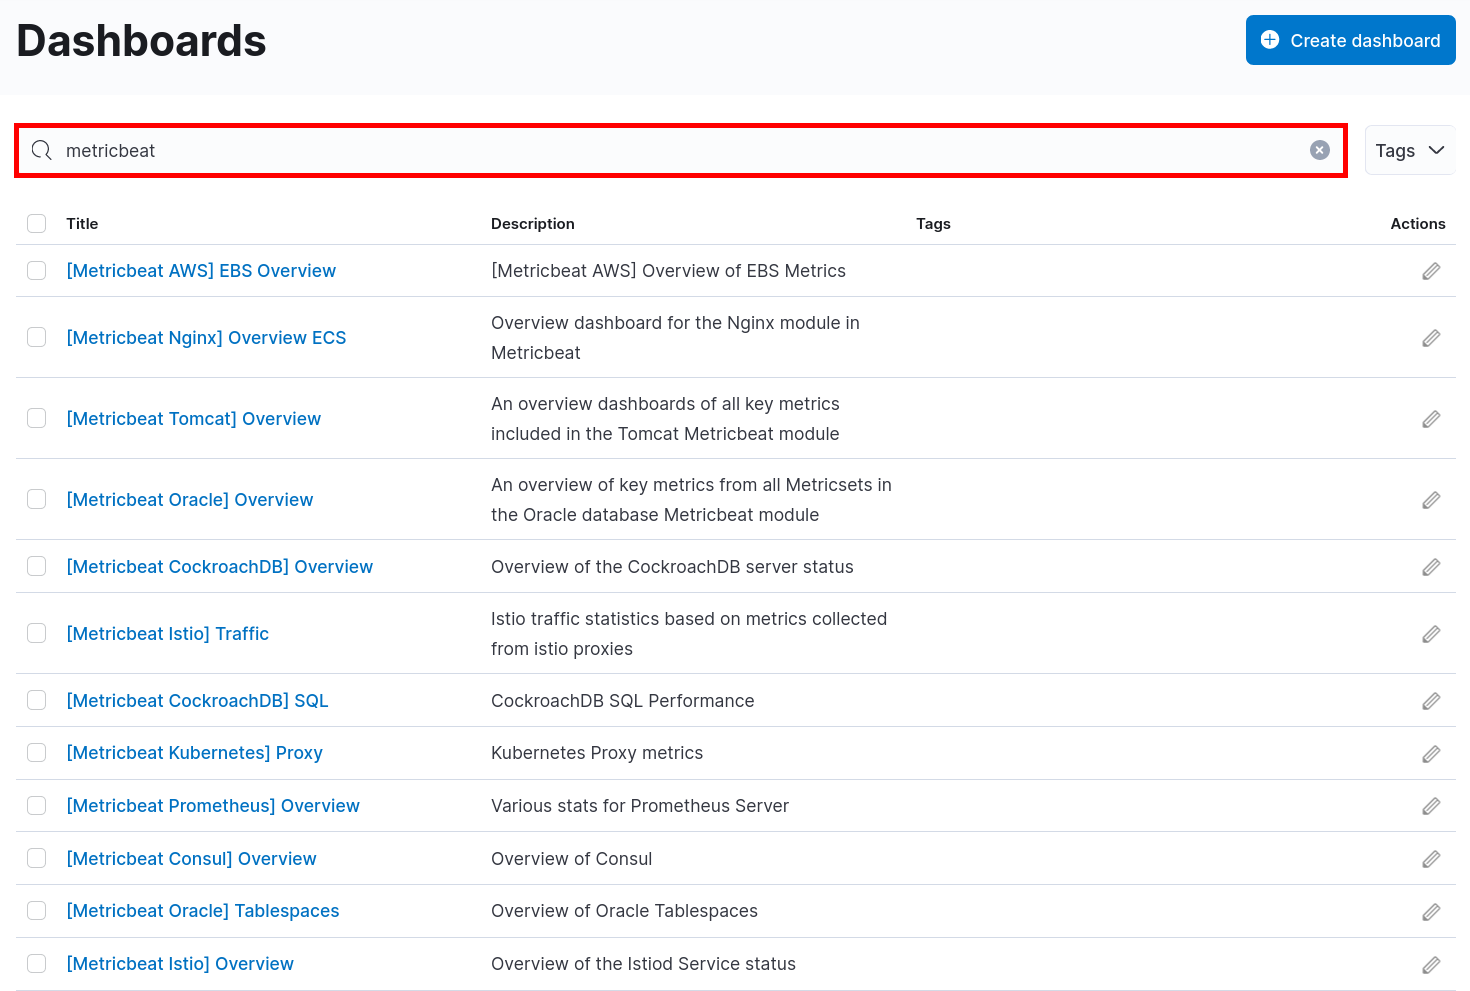
Il y a pas mal de dashboard prédéfinis pour Metricbeat nous allons voir comment les utiliser.
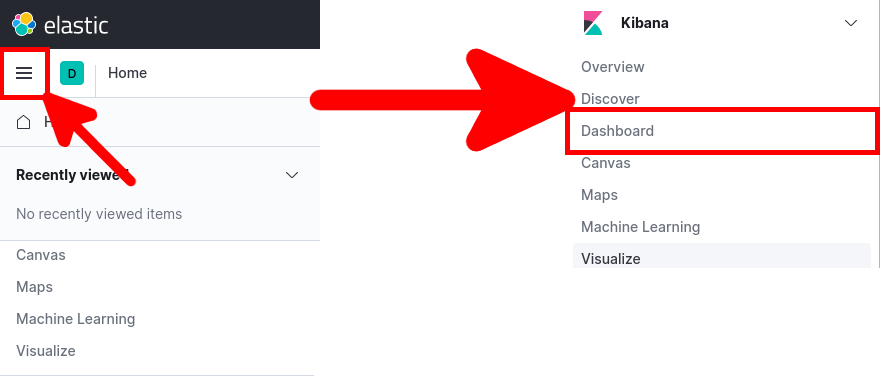
- Depuis le menu principal, aller dans Kibana > Dashboard :
- Entrer Metricbeat et choisir un Dashboard :
- Le dashboard [Metricbeat System] Overview ECS :
![Kibana | Metricbeat [Metricbeat System] Overview ECS Dashboard](images/siem/088.png)
- Le dashboard [Metricbeat System] Host overview ECS :
![Kibana | Metricbeat [Metricbeat System] Host overview ECS](images/siem/089.png)